Understanding IDV Accuracy: Confusion Matrices
The fundamental job-to-be-done of an identity verification (IDV) vendor is to help its clients determine which of the client's users are good customers, i.e. a user is verified to be who they claim to be, and which users are bad actors, impostors, or fraudsters. While there are considerations around transaction speed and cost, the question of accuracy is the most important as inaccurate verification results will have severe consequences on the client's business.
Verification results from IDV vendors are leveraged in regulated and non-regulated situations to satisfy compliance requirements, ensure trust, prevent fraud or abuse, and in many cases promote platform safety. Simply accepting a vendor's statements on accuracy is risky and can lead to hefty financial losses or severe reputation impacts. Further, one client's use case and risk tolerance may be quite different from another client's as business goals may vary including what's an acceptable tradeoff between revenue and potential loss.
IDV vendors ingest data to make probabilistic predictions that help their clients make deterministic decisions. Is this user a good customer? Or, is user this a fraudster? This is a question of classification, identifying two different populations using inputs such personal information, device data, identity documents, and biometrics.
IDV vendors ingest data to make probabilistic predictions that help their clients make deterministic decisions. Is this user a good customer? Or, is user this a fraudster? This is a question of classification, identifying two different populations using inputs such personal information, device data, identity documents, and biometrics.
The Confusion Matrix
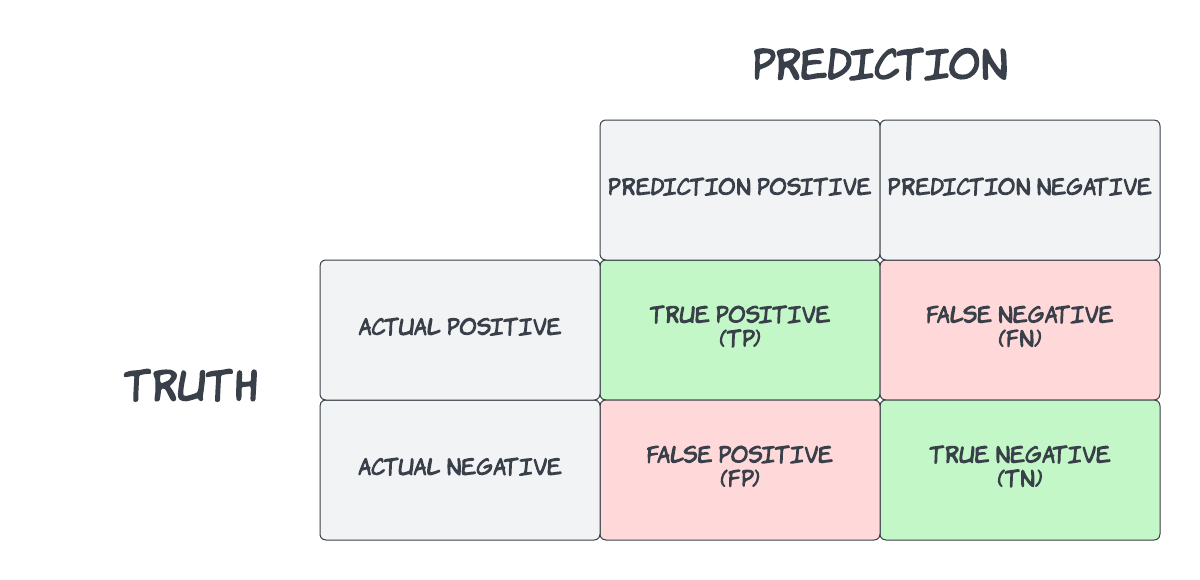
In the field of statistics and machine learning, a confusion matrix is used to visually represent the performance of a classifier’s predictions. The below table illustrates the concept of a binary classification whereby the actual result is compared to the prediction.
In the context of identity verification and fraud detection use cases, I often see confusion with confusion matrices as the terminology for identity verification and the terminology for detecting fraud are different. Identity verification and fraud detection predictions are attempting to answer different questions and as such the confusion matrices of each will be different.
Let's take a look a common identity verification technique called document-centric identity proofing and how it compares to fraud detection systems.
Document-centric Identity Proofing
Document-centric identity proofing, sometimes called document verification (DocV) or document authentication (DocAuth), is focused on proving that a user is a good customer by requesting the user to capture or upload an identity document along with a selfie photo.
IDV vendors leveraging this technique are trying to answer key questions. Is the document presented authentic? Is the person presenting the document genuinely present? Does the person match the document?
The document-centric paradigm follows the identity proofing philosophy of "something the person has" (an authentic identity document) combined with "something the person is" (face match). In an identity proofing scenario, the "something the person is" is requisite but not alone sufficient to prove identity because the user must be bound to an authentic credential, in this case the ID document. Therefore, the foundational prediction for the document-centric proofing technique is that the ID document is acceptable to be authentic, i.e. is not fake, tampered, or forged.
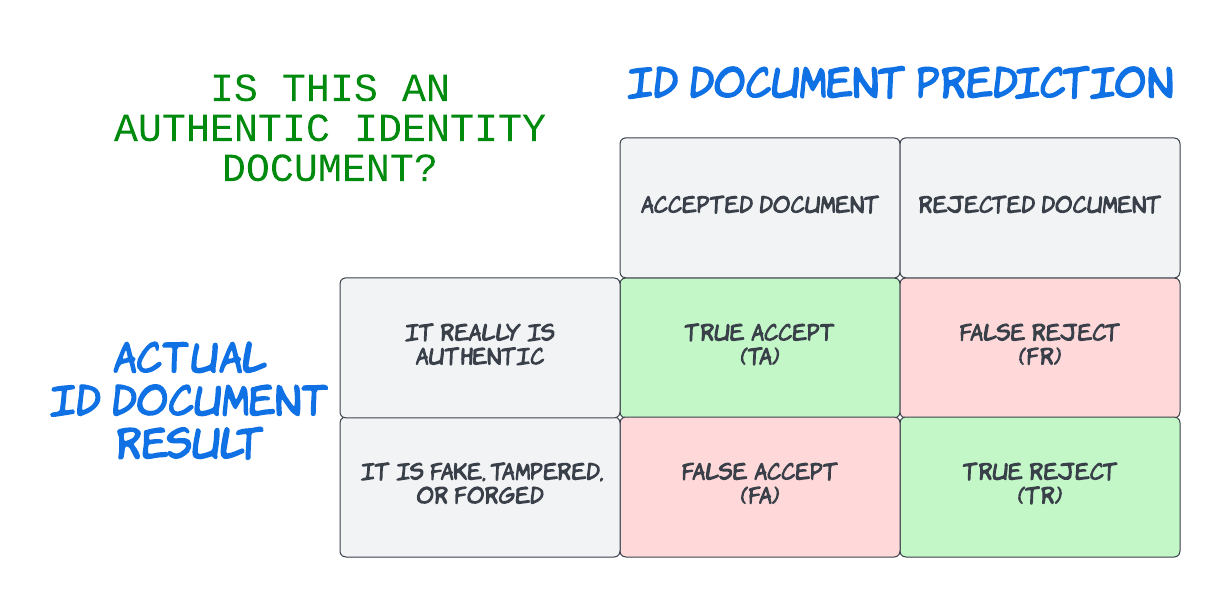
Appropriately, a confusion matrix for document authenticity might look like this:
False acceptance in document-centric identity proofing is allowing a bad actor or imposter through the process because the document was accepted to be authentic but is really fake, tampered or forged. This failure might have a major consequence depending on what the identity verification is protecting. Inversely, a false rejection is preventing a good customer from completing the transaction which may require step-up intervention with manual review. More often than not, false rejection results in additional friction leading to user attrition or dissatisfaction.
While some organizations rely solely on the document authenticity prediction, this classification only provides evidence that the person's identity exists. In order to strengthen the prediction that the person is who he or she claims to be, a selfie photo is requested. From that selfie, two additional predictions are required. First, is this person actually present, or is this user attempting a spoofing attack? Second, does the person in the selfie match the portrait on the document? Each of these predictions will also have its own confusion matrix thus increasing the potential for error.
The below confusion matrix focuses on the question "does this selfie match the ID portrait" and the scenarios where a face match prediction is paired against the reality of two different face images being that of the same face or of two different faces.
What’s important for document-centric identity proofing accuracy is the vendor’s overall False Acceptance Rate (FAR) and False Rejection Rate (FRR - pronounced FUR) which should be inclusive of document authenticity, face matching, and face liveness. The FAR/FRR of a document-centric identity proofing system represents overall accuracy expectations but of course will vary depending on configuration and inputs at each stage.
Fraud Detection
Fraud detection systems, on the other hand, are focused on identifying fraud by which fraud is considered the positive class. This is similar to the medical field where a physician is detecting the presence of a particular disease. In both scenarios, the positive signal is the undesirable outcome. A fraud system uses inputs to make a prediction about whether or not a user or a transaction is fraudulent. The foundational prediction for fraud detection is the presence of deception or misrepresentation in the transaction.
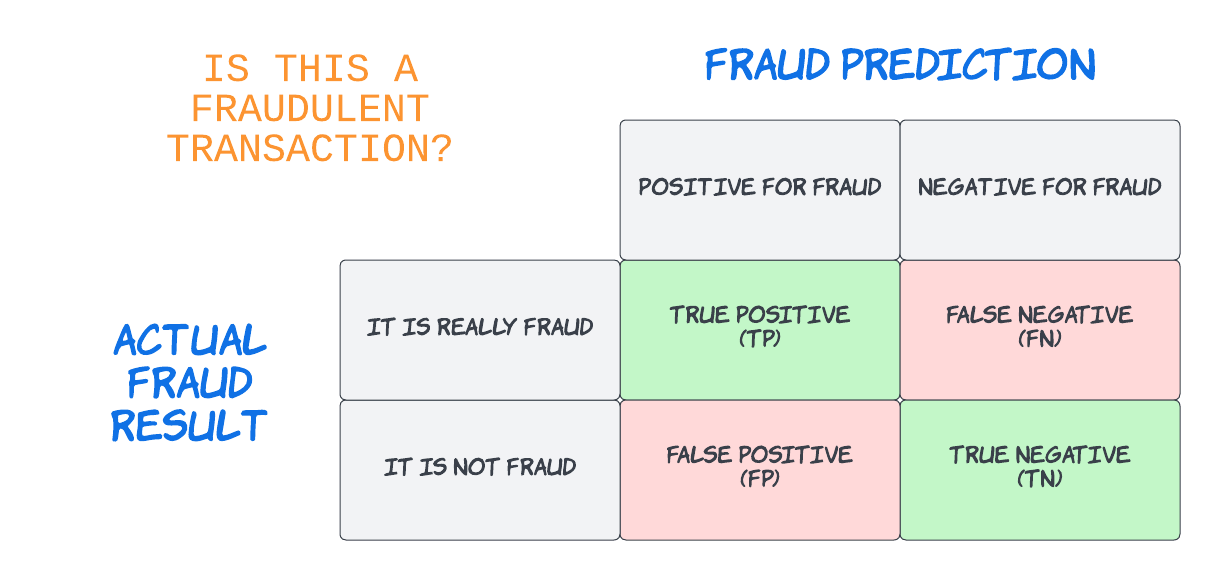
Appropriately, a confusion matrix for fraud might look like this:
False positives in fraud detection are inaccurately flagging a good transaction as a fraud or as risky. False positives hurt the business because they are an impediments that create friction or transaction failure. They may require step-up intervention either with manual review or with other automated techniques. A false negative in a fraud prediction is failing to catch the fraud and those misses will result in fraud losses or abuse.
For fraud detection, False Positive Rate (FPR) and False Negative Rate (FNR) are the important measures of prediction accuracy.
Operating Points and ROC Curves
Thus far, I’ve highlighted the relevance of confusion matrices in evaluating accuracy. It becomes more difficult to assess the performance of a classification when introducing the concept of operating points. Many IDV and fraud detection vendors offer the ability to adjust scores and thresholds to shift accuracy in favor of higher or lower FAR/FRR in the case of document-centric vendors or FPR/FNR for fraud detection. A more common representation of a vendor’s capabilities is demonstrated through a receiver operating characteristics curve, or ROC curve.
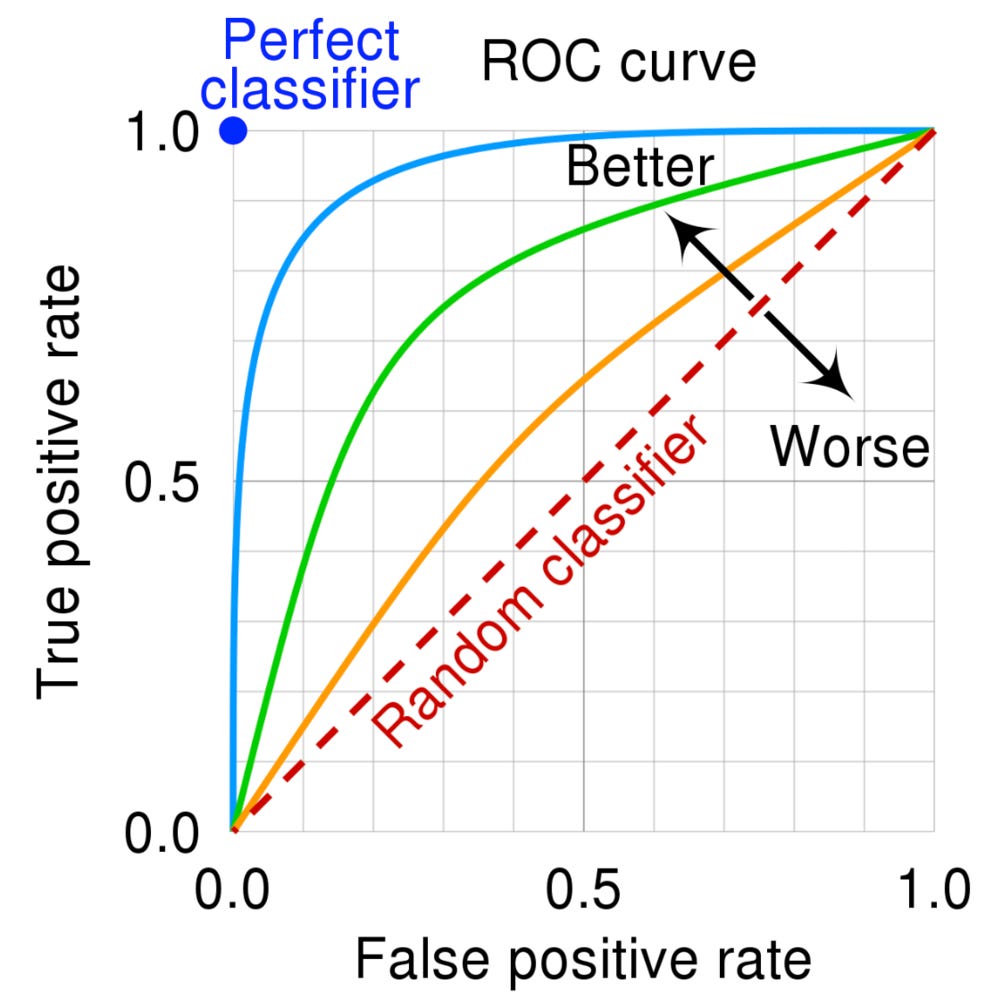
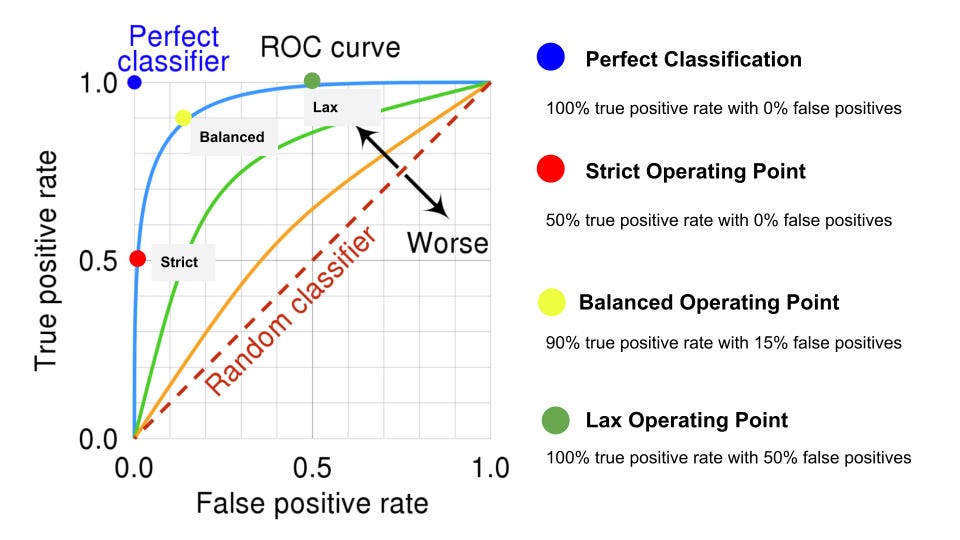
The ROC curve is used to visually depict accuracy across various thresholds, a curve of all possible confusion matrices, and often looks like this:
In the above diagram, the blue dot represents a perfect classifier i.e. a perfect prediction. The red dashed-line represents random classification (a 50/50 coin toss). The orange, green, and blue lines represent progressively improving classification results.
The actual results an organization might experience, and the corresponding confusion matrix, depends on where the operating point or threshold is set. The operating point determines performance and where that point should be set depends on the use case, the consequence of being inaccurate in either direction, and the client's business goals.
The actual results an organization might experience, and the corresponding confusion matrix, depends on where the operating point or threshold is set. The operating point determines performance and where that point should be set depends on the use case, the consequence of being inaccurate in either direction, and the client's business goals.
The operating point moves along the curved line and will determine true positive and false positive rates. In the diagram below, three different operating points are introduced.
In a Strict operating point, false positives are kept to a minimum but true positive rate suffers. This operating point would be leveraged where the cost of being wrong has a severe consequence.
Alternatively, a Lax operating point will ensure maximum true positives but at the cost of many false positives. A lenient strategy would be used when false positives do not have a material impact on the business.
Finally, in a Balanced operating a high true positive rate is achieved with a relatively low false positive rate. A balanced scenario provides a tradeoff between the two approaches.
The reality is an operating point can be set anywhere along the curve and the ideal configuration will depend on the business use case and risk tolerance. However, not all vendors in IDV or fraud detection provide a mechanism for adjusting tolerances. Or, if they do, they may have a challenge providing the correlation between configuration and output accuracy. Further, some vendors may provide test or trial environments tuned to a specific operating point to demonstrate maximum true positive rates but then have different operating points for production or real-world usage. This can make results a moving target.
Area Under the Curve
Since operating points determine performance with respect to True Positive Rates and False Positive Rates, a more useful measure of overall accuracy of a classifier is the concept of Area Under the Curve or AUC. In the ROC curve diagrams above, AUC would be represented by a shaded region to the right of each line. The more accurate the classifier, the more area under the curve. AUC is generally measured between 50% (random) and 100% (perfect classification). High AUC classifiers reduce the reliance on the tradeoff between true positive and false positives when setting a threshold.
The Ugly Truth
Across the concepts of confusion matrices, ROC curves, and AUCs, there is a critical assumption that the actual or true outcome for a classifier is known. This is particularly important for the development of the classifier. When known outcomes, or ground truth, are available, the creation of the classifier model is considered to be a supervised training process. This ground truth data is collectively referred to as the training set and the more training data available, the more accurate the classification can become.
Many IDV and fraud detection vendors will provide their accuracy statistics as measured in laboratory settings using a different set of data that was not used in training predictions. This extra data is called a validation set and while representative of real-world data it is usually not exhaustive of all potential scenarios. In some cases, this validation set isn't even statistically relevant. Therefore, if vendor accuracy is derived solely from validation sets, it should be evaluated with skepticism.
Best in class IDV and fraud vendors have a process for frequently auditing and validating their production results. The mechanism for how they do this will vary but the underlying business goal is to ensure their products are performing appropriately at scale and in the real-world.
Maximizing Accuracy
IDV and fraud detection accuracy is a complex topic and confusion matrices can be confusing when conflating identity verification with fraud detection. Document-centric identity proofing and fraud detection vendors offer a variety of options and configurations and it can be challenging to assess performance during the buying journey.
To select the right solution, an organization should conduct a thorough, empirical data analysis that keeps success criteria and acceptable tradeoffs in mind. Don't just ask vendors about FAR/FRR and FP/FN rates, trust their response, and move on to the next topic. Verify with your own production data populations to ensure the vendor's accuracy performance meets your expectations. This will require your organization to sample your own user population, generate your own ground truth from known outcomes, label the data appropriately, and organize the data for structured vendor testing.
If you need help with this evaluation process, please reach out to the team at PEAK IDV.


